- Cost-effective solutions for assemblies
- Solving your fastening problems
- Torque curve analysis for assembly
- Clamping force in plastic assemblies
- Magnesium assemblies fastening solutions
- Screw technology catalogues
Torque curve analysis
Torque curve is the main tool to analyze and study any assembly in detail.
The torque curve is obtained by registering the torque values at each angle or time increment during the fully threading of the screw until its failure.
By analyzing the torque curve, our application engineers infer a considerable amount of valuable information for our customers on the performance of the screw at that particular assembly. The main data obtained are as follows:
- the recommended parameters for a correct set up and optimization of the assembly line.
- the validation of the design.
- the stability and ergonomics of the assembly.
To make the most out of this test, adequate knowledge and proper understanding of the information provided by the torque curve are required.
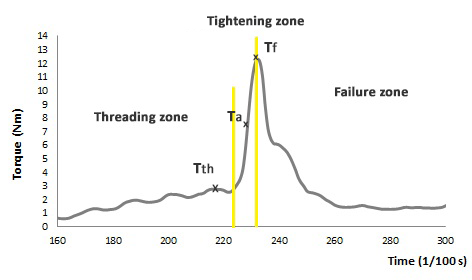
The curve below depicted corresponds to tightening of REMFORM® screw diameter 6 on PBT+30GF plastic part.

Threading zone: corresponds to torque and angle values until the head of the screw touches the cover part. The following parameters are to be considered:
- Threading torque Tth: is the minimum torque necessary to ensure that some clamping force is loaded to the assembly. This value is represented by the maximum torque within this zone.
- Threading energy is the area under the curve within the threading zone. The lower this area, the more ergonomic the assembly will be (less effort for the screwdriver), but less vibration loosening resistance.
- Threading angle: this value corresponds to the turns necessary to insert the screw. Low angle values allow higher production lines.
Tightening zone: this value corresponds to torque and angle values just from the moment the clamp load starts until the assembly fails.
- Optimal assembly torque Ta: this value corresponds to torque and angle values just from the moment the clamp load starts until the assembly fails..
Failure zone:this value represents torque and angle values after the clamp load becomes zero.
- Failure torque Tf: this is the torque value when the assembly fails at any point. It is the maximum torque allowed in the system and corresponds to the maximum value (peak) of the curve within thiszone.
- Failure mode: it is a description of the assembly failure. Typical failure modes are stripping off, screw breaking and recess damage.
The stability of the assembly is determined by the difference between threading torque and failure torque.

